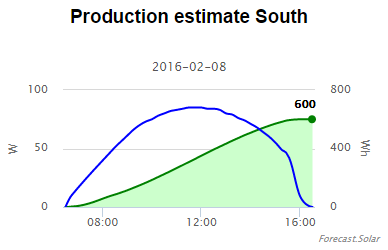
Solar production estimate chart
(Professional accounts only)
You can direct draw forecast estimate charts via API calls.
The logic for the chart drawing URL is a bit different. In other calls you have to use your API key for calls.
But the needed code snippet here is placed into a HTML page and the API key should not be visible for the public 
So the process of drawing a chart consists of 3 parts:
- Request a unique token for your plane(s), combine up to 3 (you can build the URL with the helper page and get the script tag directly with the Test button)
- Init JavaScript chart functions, once per page
- Draw concrete chart by placing the JavaScript snippet exact at the place, where the chart should be shown.
1. Request a unique token
https://api.forecast.solar/:key/chart/:lat/:lon/:dec/:az/:kwp
https://api.forecast.solar/:key/chart/:lat/:lon/:dec1/:az1/:kwp1/:dec2/:az2/:kwp2
https://api.forecast.solar/:key/chart/:lat/:lon/:dec1/:az1/:kwp1/:dec2/:az2/:kwp2/:dec3/:az3/:kwp3
Result will be something like this:
{
    "result": {
        "token": "pDvJw75F",
        "url": "https://api.forecast.solar/chart/pDvJw75F.js",
        "tag": "<script defer src='https://api.forecast.solar/chart/pDvJw75F.js'></script>"
    },
    "message": {
        "code": 0,
        "type": "success",
        "text": ""
    }
}
2. Code
Chart URL for today
https://api.forecast.solar/chart/0/pDvJw75F.js
The offset of 0 is optional and this will work the same way:
https://api.forecast.solar/chart/pDvJw75F.js
Chart URL for tomorrow
https://api.forecast.solar/chart/1/pDvJw75F.js
You can draw the chart up to 6 days in advance!
Please load the scripts always defered to not block the page loading!
<-- ----------------------------------------------------------------------
 -- Init chart functions, required only ONCE per page
 -- Put this always BEFORE the chart scripts!
 -- ------------------------------------------------------------------ -->
<script defer src="https://api.forecast.solar/chart/init.js"></script>

<div style="text-align:center">
    <-- ------------------------------------------------------------------
     -- Custom header
     -- -------------------------------------------------------------- -->
    <h3>Production estimate South</h3>

    <-- ------------------------------------------------------------------
     -- Wrap script with a DIV with dimensions to define chart size
     -- -------------------------------------------------------------- -->
    <div style="width:400px;height:200px;margin:auto">
        <script defer src="https://api.forecast.solar/chart/pDvJw75F.js"></script>
    </div>
</div>
Parameters
You can provide 2 parameters to the script:
title- Chart titlesubtitle- Chart subtitle
You can in both parameters use the follwing placeholders:
{place}- Location of the plant{date}- Chart date
If nothing is provided, no tilte is drawn and the subtitle becomes the date.
If the title contains the {date} placeholder, the subtitle will not show the date.
Full example
https://api.forecast.solar/chart/1/pDvJw75F.js?title=Chart+for+{date}&subtitle={place}
3. Result