This is an old revision of the document!
Solar production estimate chart
(Professional account only)
You can direct draw forecast estimate charts via API calls.
The logic for the chart drawing URL is a bit different. In other calls you have to use your API key for calls.
But the needed code snippet here is placed into a HTML page and the API key should not be visible for the public 
So the process of drawing a chart consists of 3 parts:
- Request a unique token for your plane(s), combine up to 3 (You can build the URL with the helper page and get the script tag directly with the Test button.)
- Init JavaScript chart functions, once per page
- Draw concrete chart by placing the JavaScript snippet exact at the place, where the chart should be shown.
1. Request a unique token
https://api.forecast.solar/:key/chart/:lat/:lon/:dec/:az/:kwp
https://api.forecast.solar/:key/chart/:lat/:lon/:dec1/:az1/:kwp1/:dec2/:az2/:kwp2
https://api.forecast.solar/:key/chart/:lat/:lon/:dec1/:az1/:kwp1/:dec2/:az2/:kwp2/:dec3/:az3/:kwp3
Result will be something like this:
{
    "result": {
        "token": "pDvJw75F",
        "url": "https://api.forecast.solar/chart/pDvJw75F.js",
        "tag": "<script defer src='https://api.forecast.solar/chart/pDvJw75F.js'></script>"
    },
    "message": {
        "code": 0,
        "type": "success",
        "text": ""
    }
}
2. Code
Chart URL for today
https://api.forecast.solar/chart/0/pDvJw75F.js
The offset of 0 is optional and this will work the same way:
https://api.forecast.solar/chart/pDvJw75F.js
Chart URL for tomorrow
https://api.forecast.solar/chart/1/pDvJw75F.js
You can draw the chart up to 6 days in advance!
<-- ----------------------------------------------------------------------
-- Init chart functions, required only once per page
-- ------------------------------------------------------------------ -->
<script defer src="https://api.forecast.solar/chart/init.js"></script>
<div style="text-align:center">
<-- ------------------------------------------------------------------
-- Custom header
-- -------------------------------------------------------------- -->
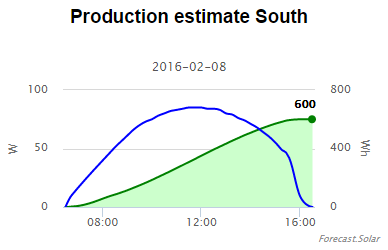
<h3>Production estimate South</h3>
<-- ------------------------------------------------------------------
-- Wrap script with a DIV with dimensions to define chart size
-- The chart works perfect with deferred loading!
-- -------------------------------------------------------------- -->
<div style="width:400px;height:200px;margin:auto">
<script defer src="https://api.forecast.solar/chart/pDvJw75F.js"></script>
</div>
</div>
3. Result